
Know what every site is earning, and why it changed.
Parking Mind brings your parking payments, sessions, PCN issuance and PCN payments together, then compares every site, machine and feed against its own normal. You start each day with a short list of what has changed and where the money is, not a stack of portal exports.
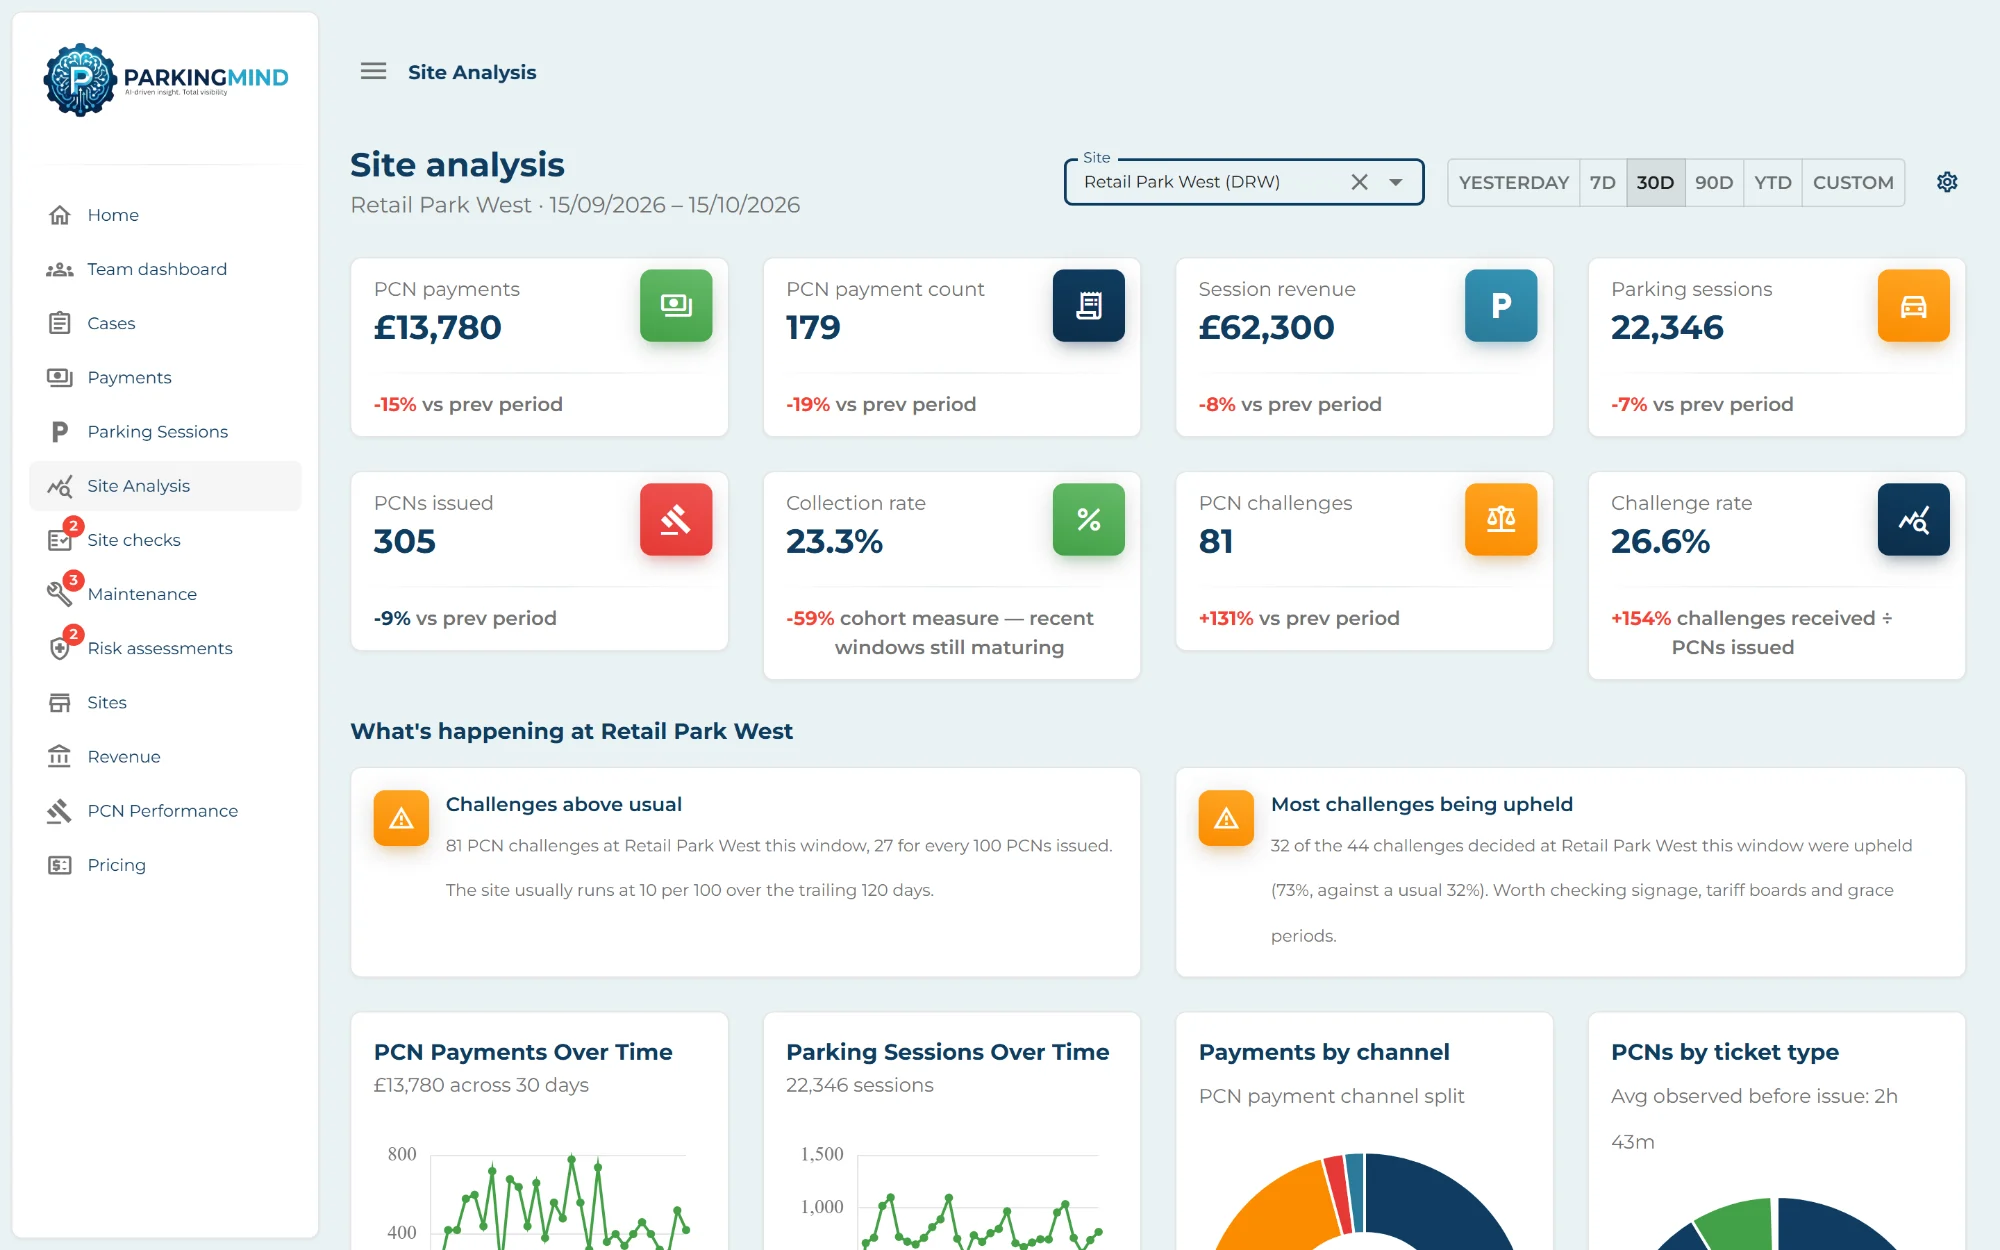
A daily briefing of what needs looking at
Every morning Parking Mind compares each site, machine and data feed with its own history for that day of the week. Anything that has dropped well outside its normal range becomes a card, ranked by its likely cost to you, with one click through to the page that explains the number.
- Spots silent pay machines, falling revenue and drops in PCN issuance
- Flags ANPR coverage gaps and complaint volumes above your KPI
- Ranked by estimated £ impact, so the costliest problem comes first
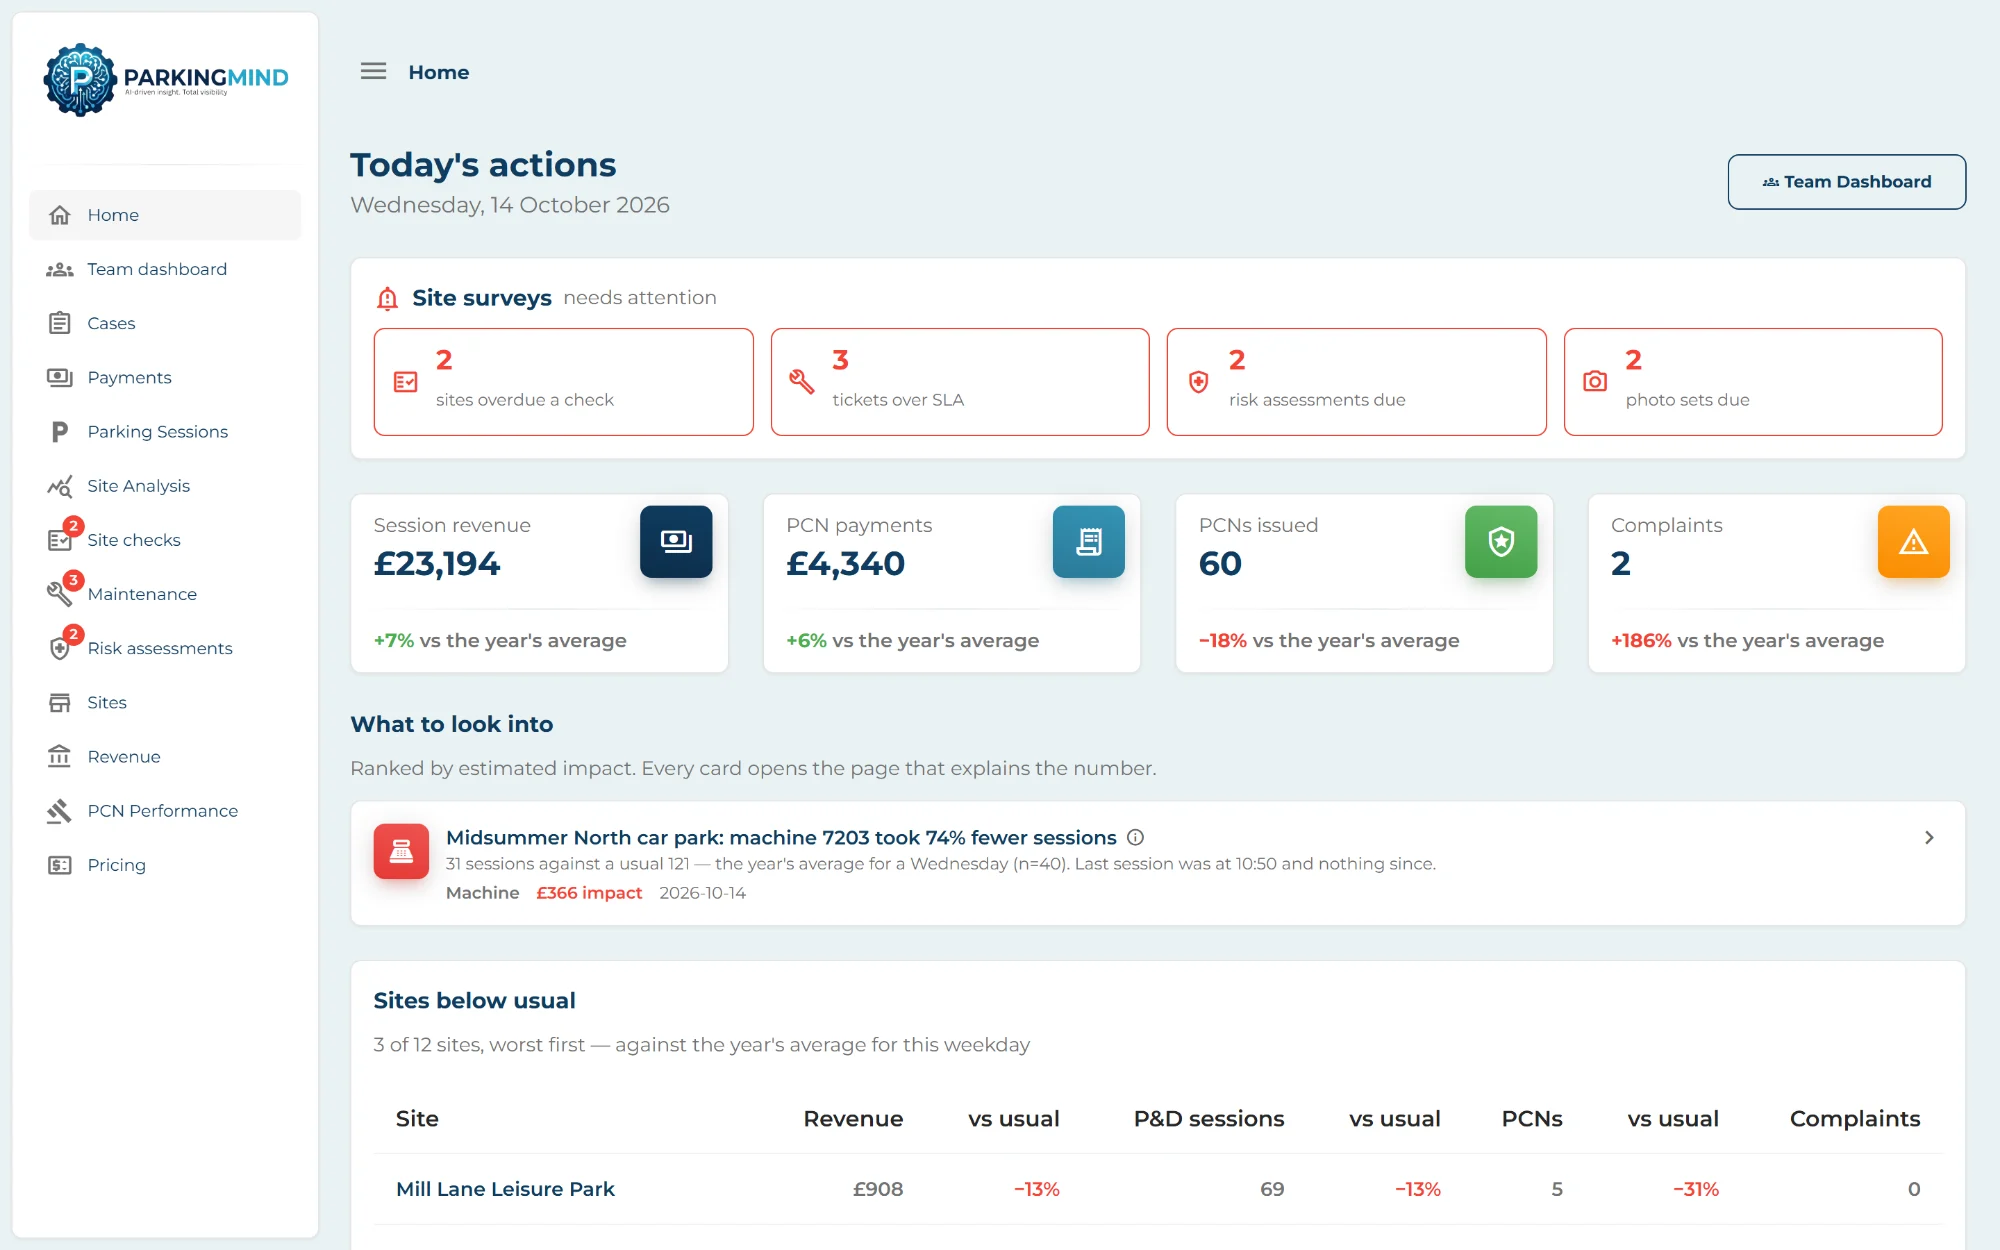
Revenue by site, channel and month
See parking and PCN income for every site against the year's monthly average, with the current month projected from the days completed so far. Drill into a site to see which channel is carrying it.
- Parking and PCN income side by side
- Month-to-date with a full-month projection
- Site drill-down by payment channel
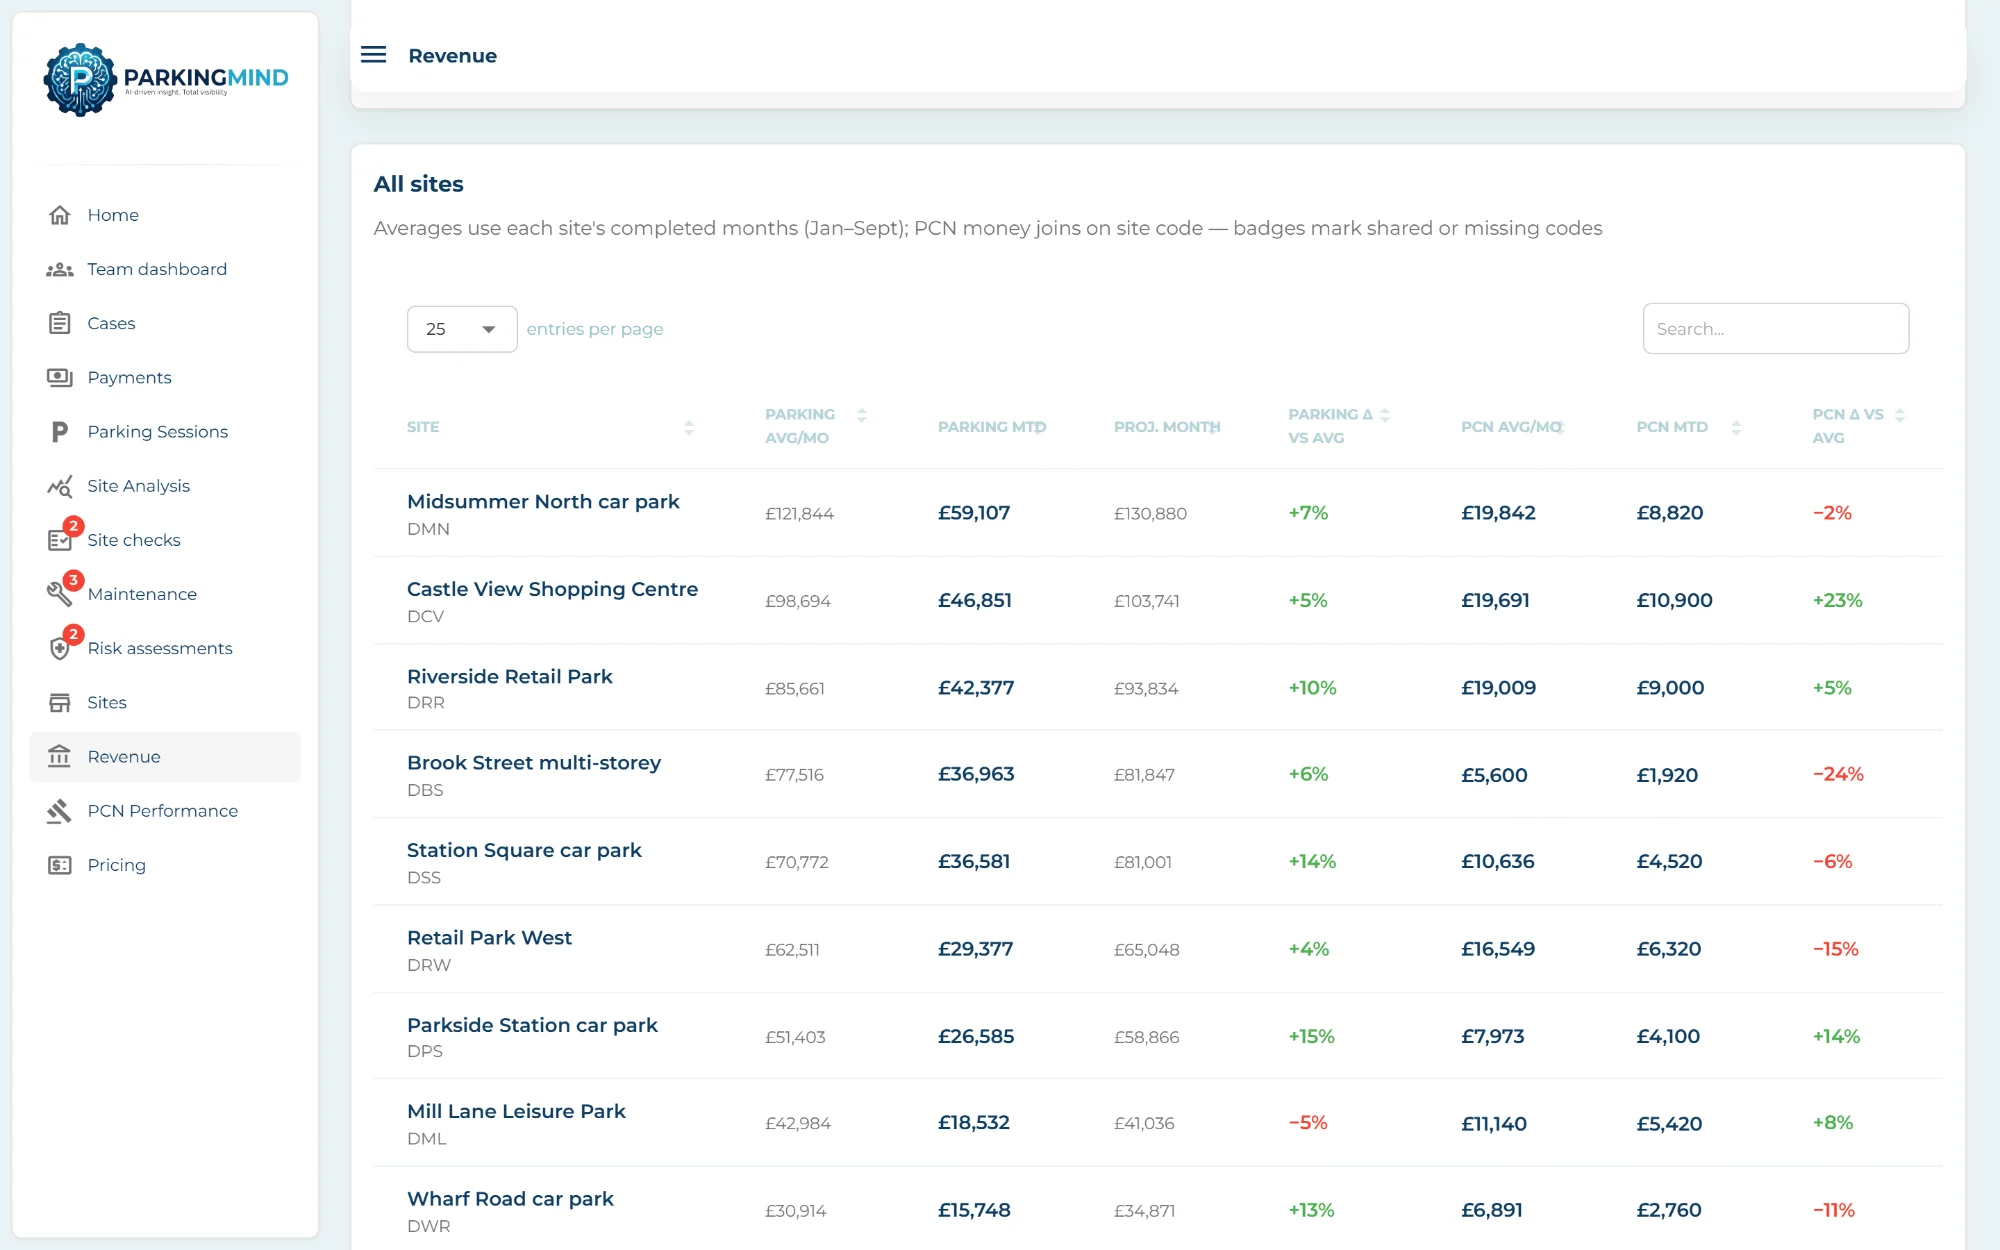
PCN performance you can act on
Follow every month's tickets through to payment. Collection rate is measured by issue cohort, so you can see how well each month's PCNs are converting, alongside void rate, enforcement latency and ticket-type mix.
- Cohort collection rate by month of issue
- Void rate and enforcement latency
- Ticket-type mix across your estate
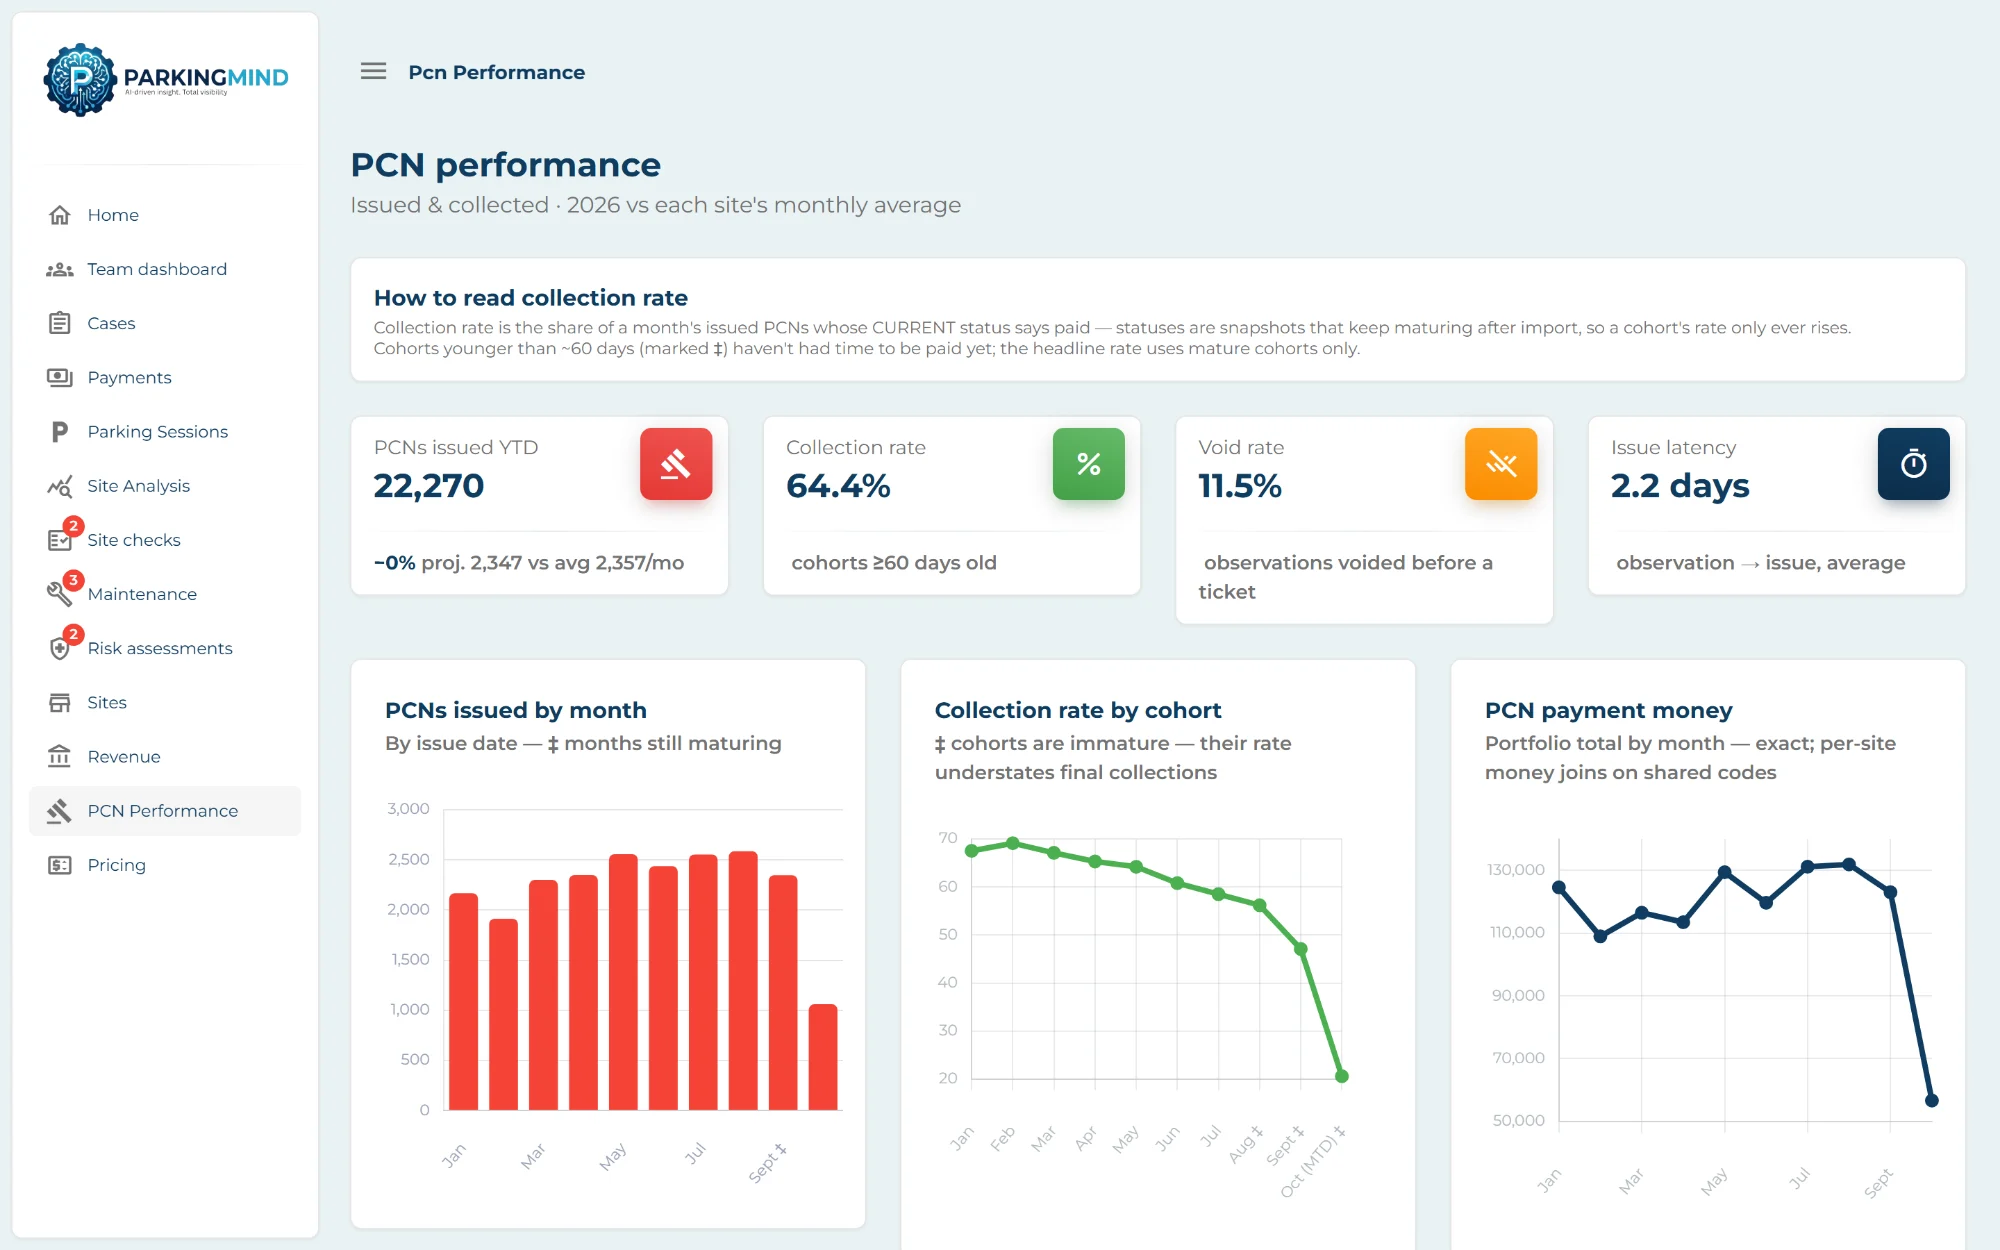
Challenges, appeals and site-level insight
Pick a site and a date range to see its payments, sessions, PCN issuance and collection together, with plain-English insights written from the numbers. Challenge counts and rates sit alongside, so a site where challenges are climbing, or mostly being upheld, stands out before it costs you.
- Challenge count and rate per 100 PCNs, with the upheld share
- Insights such as “Challenges above usual” and “Quiet feed”
- Collection rate, void rate and issuance against the site's normal
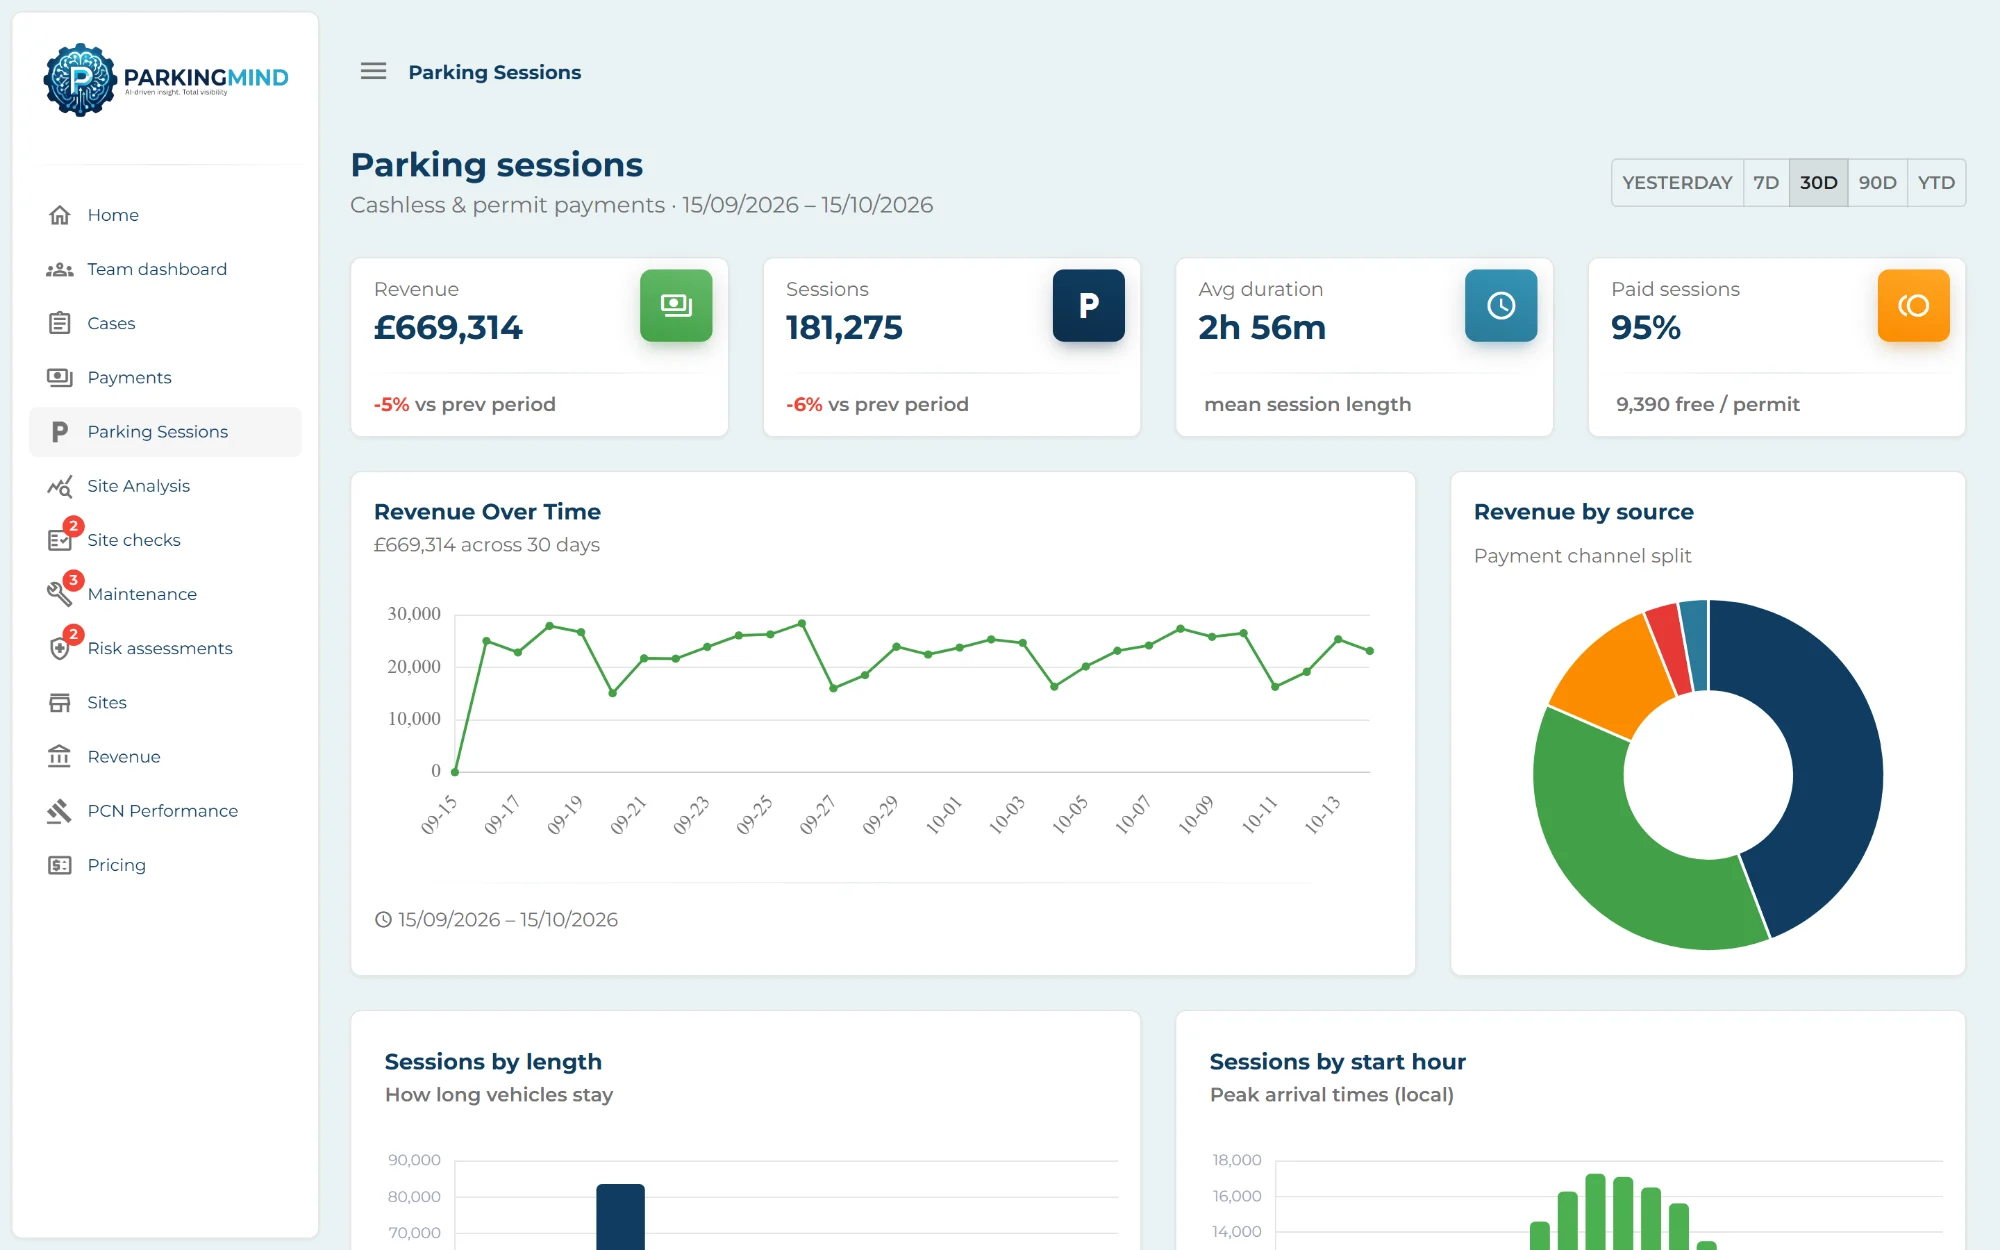
Payments and parking sessions in detail
Every transaction and session from your payment channels, by site and machine. See when people arrive, how long they stay and which machines are carrying the load.
- Revenue, sessions and average stay per site
- Sessions by length of stay and by start hour
- Breakdown by payment source and machine
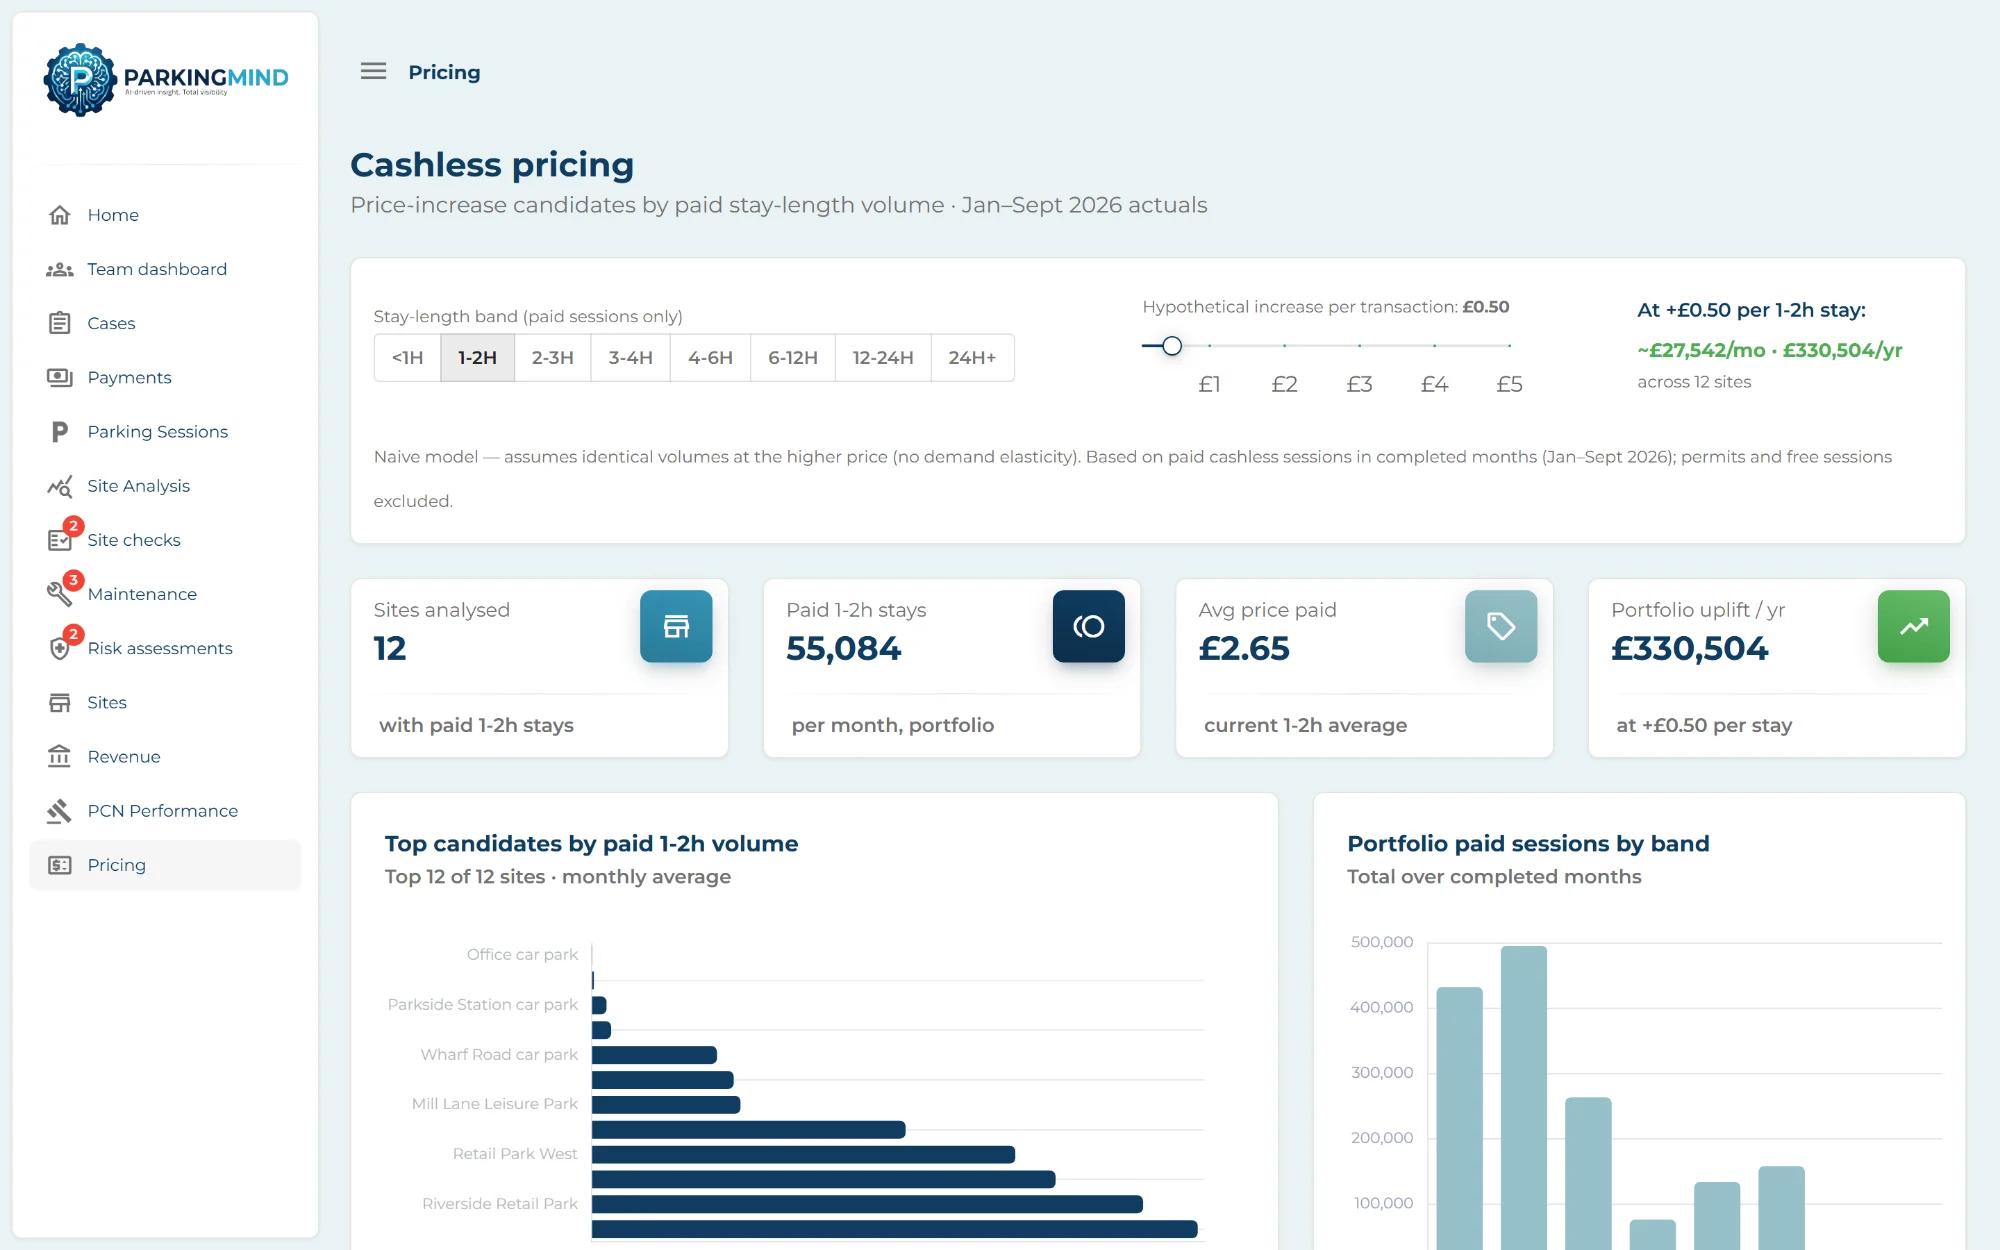
Model a tariff change before you make it
Rank your sites by stay-length band and try a price change with a slider. Parking Mind shows what the change would add on your current volumes, so tariff reviews start from your own numbers.
- Uplift by stay-length band, from 10p to £5
- Site-by-site ranking on your actual sessions
- A clear starting point for tariff reviews
One platform underneath, so every package works together.
Your data, imported automatically
Payment, session and PCN data arrives on a schedule from the systems you already use, mapped through one shared data dictionary.
One directory of sites
Every car park's set-up and performance in one place, from spaces and fees to PCNs issued and collection rate.
Roles and permissions
Give each person the access they need, with financial data and site management switched on per user.
Your brand, your rules
Your colours on the public portal, and your own categories, questions and response times.
Explore the other packages
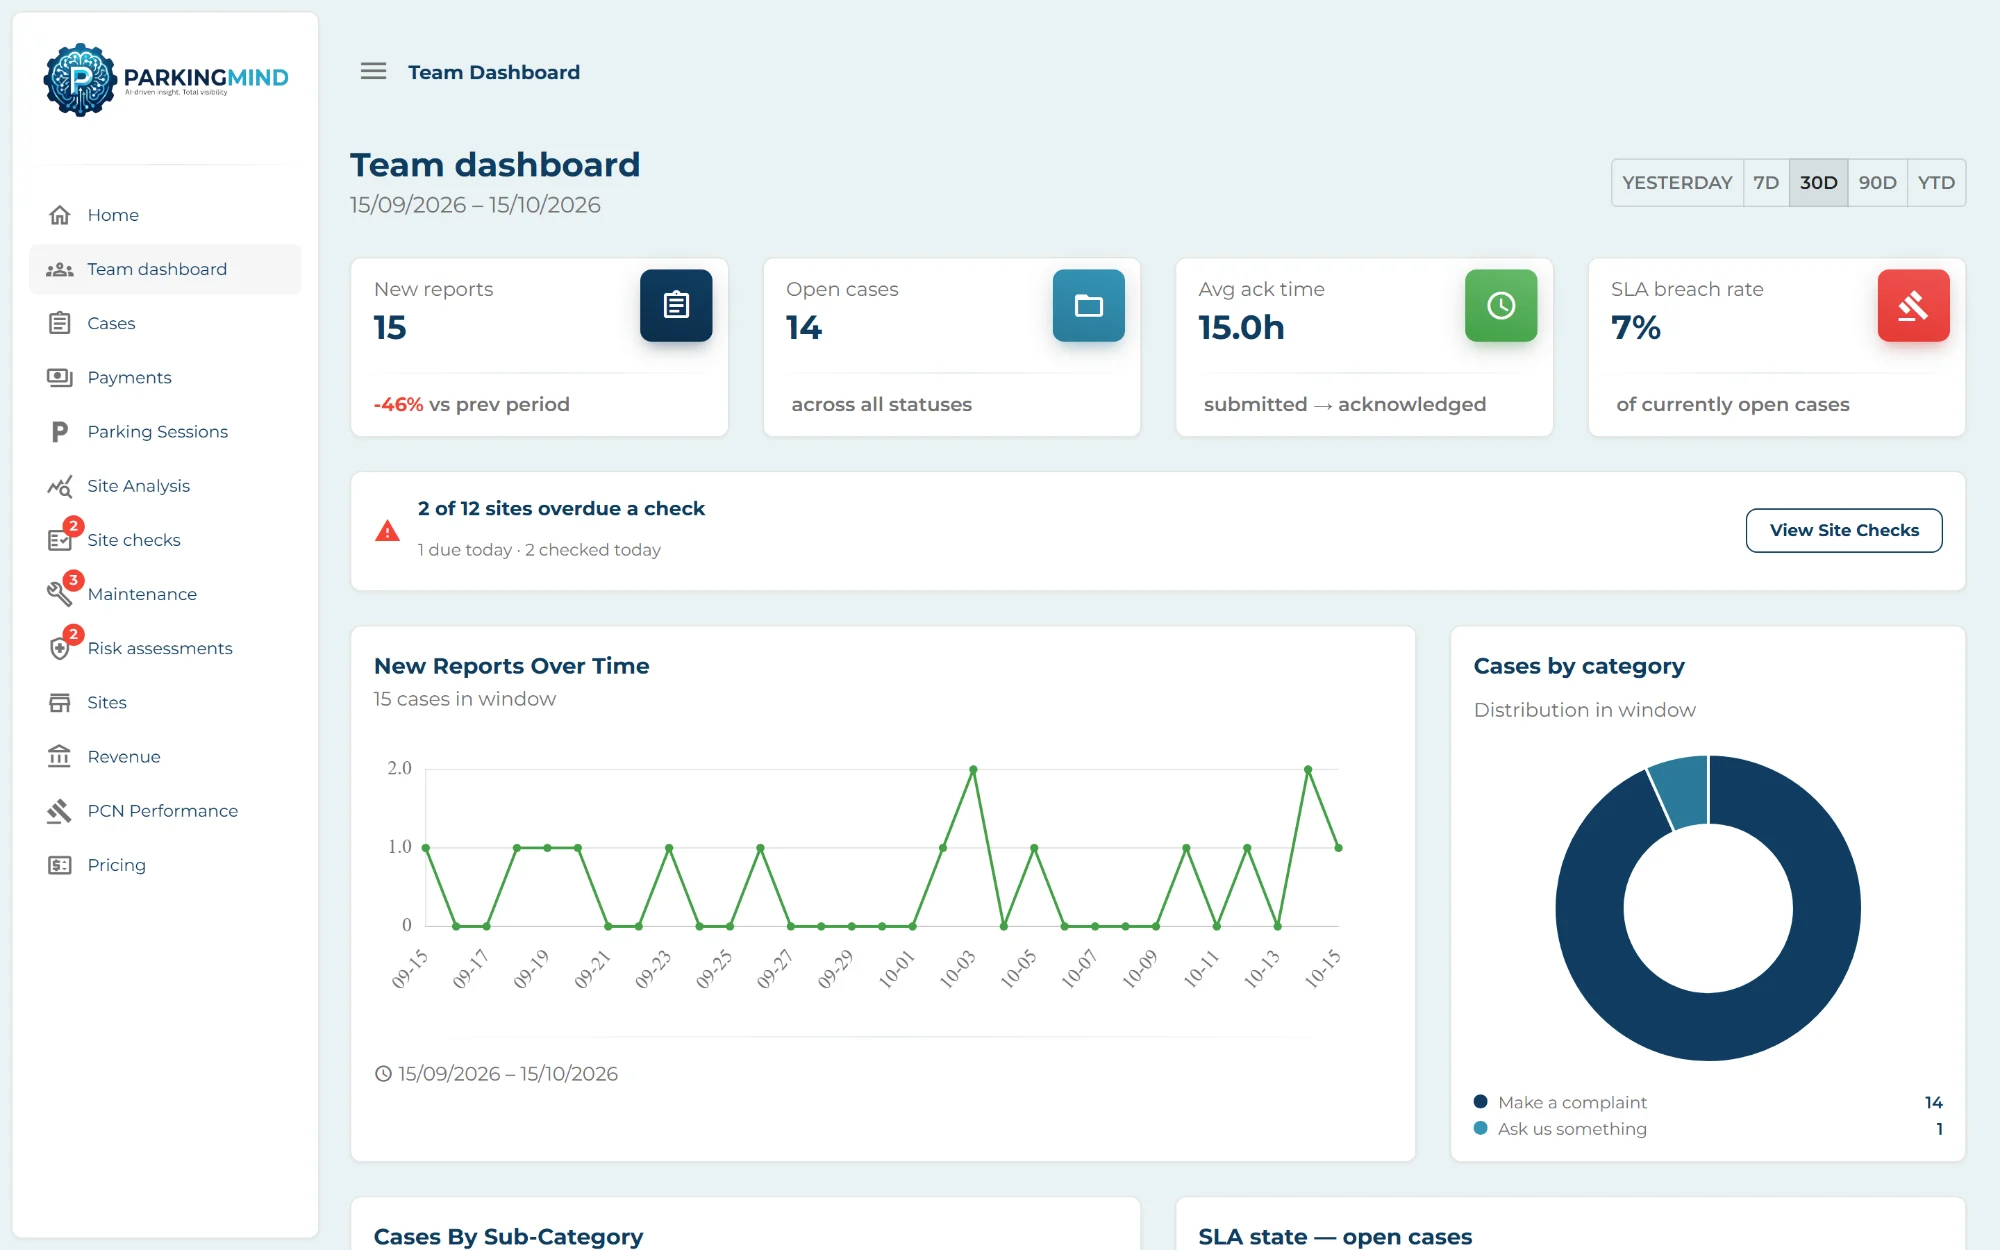
Public Engagement
A branded public portal that answers questions and takes complaints, AI-assisted intake from your inbox, and tracked cases with automated comms, SLAs and KPIs.
Explore Public Engagement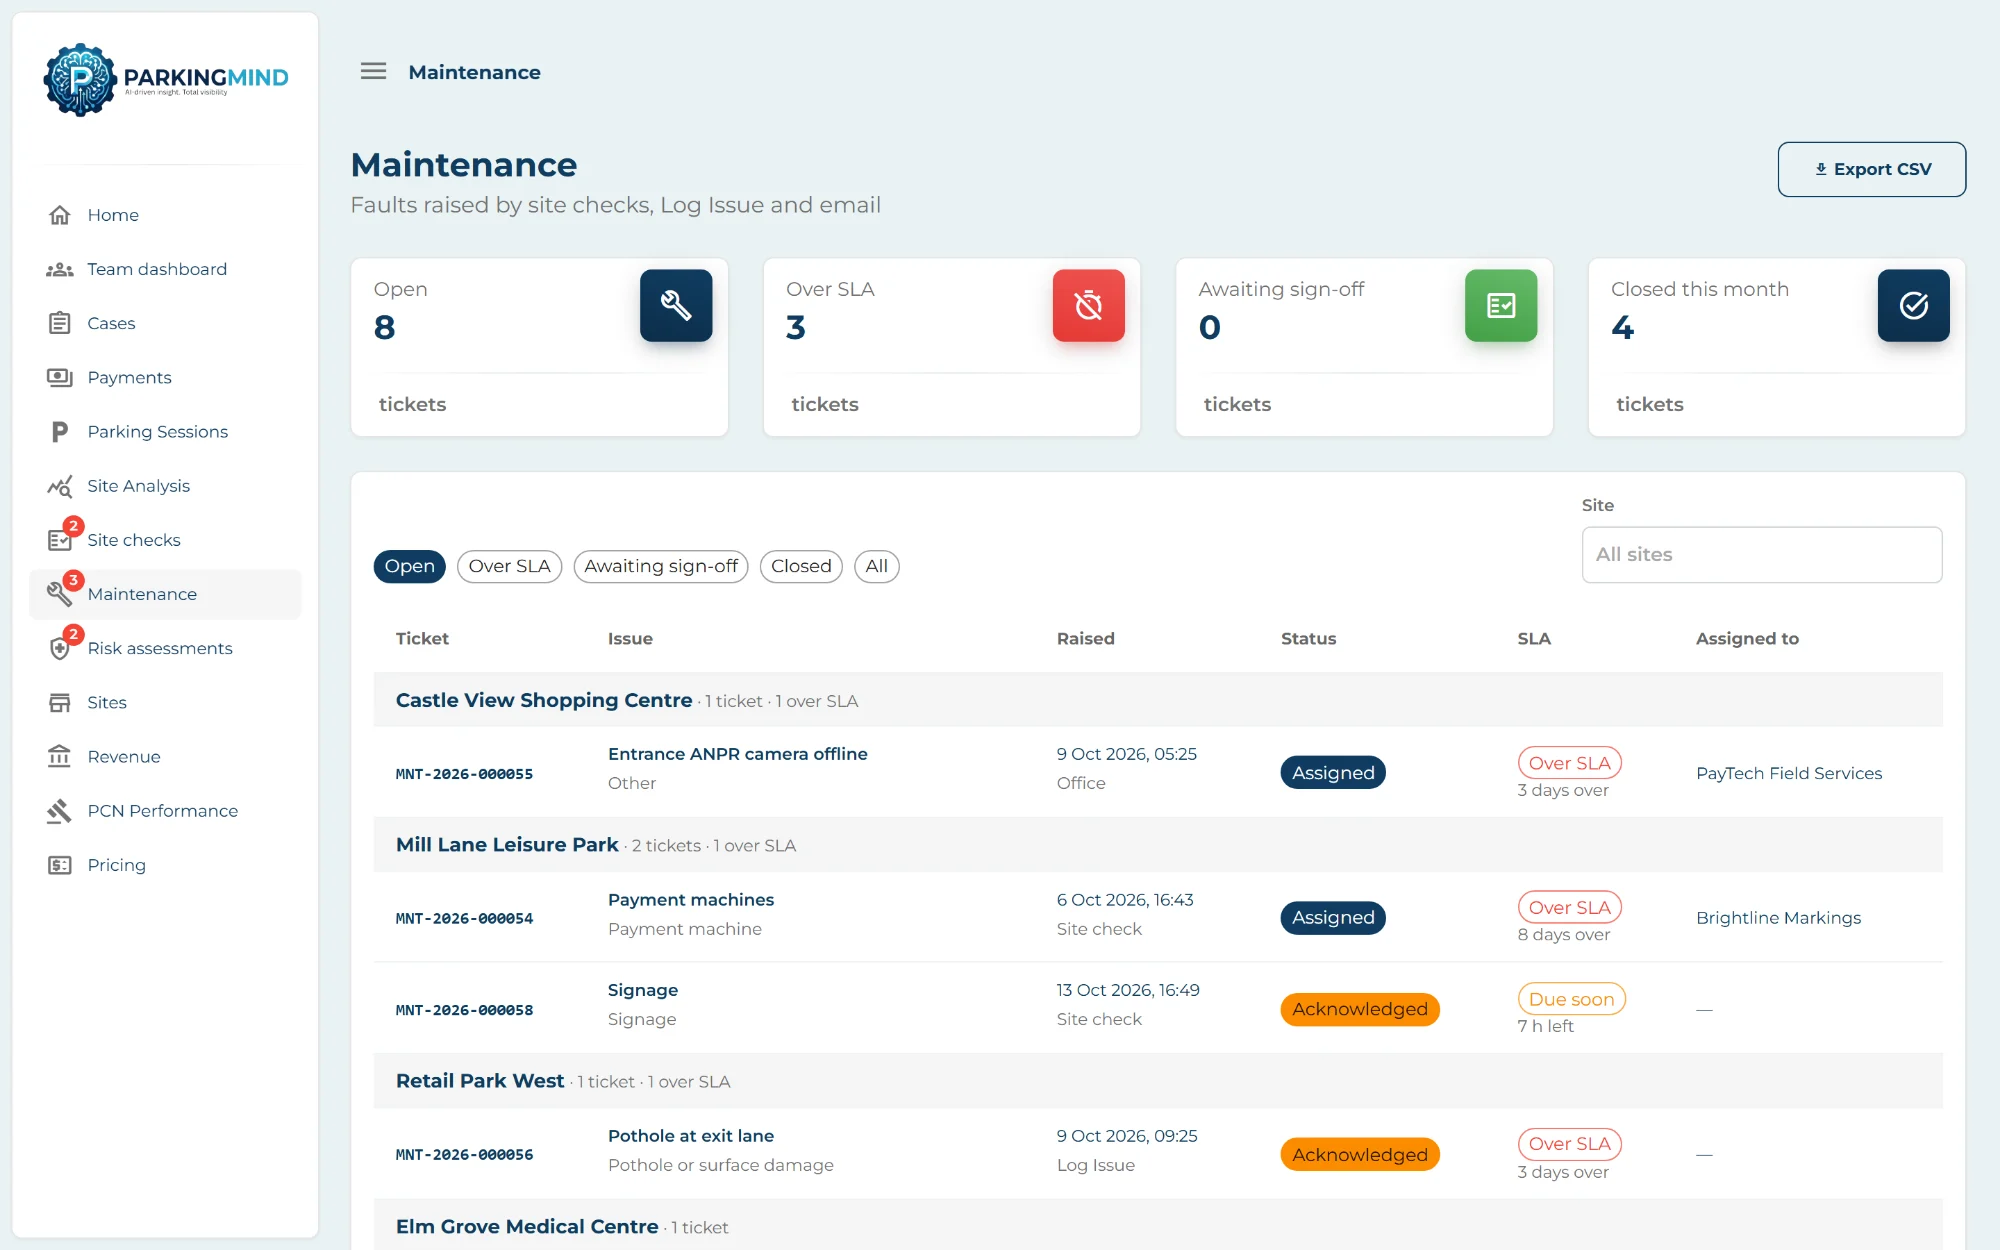
Site Management
Site surveys on the attendant's phone, maintenance tickets raised from what they find, health and safety risk assessments, and schedules and KPIs that chase themselves.
Explore Site ManagementSee Revenue & PCN Performance running on your own data.
We'll walk you through it with a demo dataset, then talk about what it would take to connect yours.